Custom Dashboards
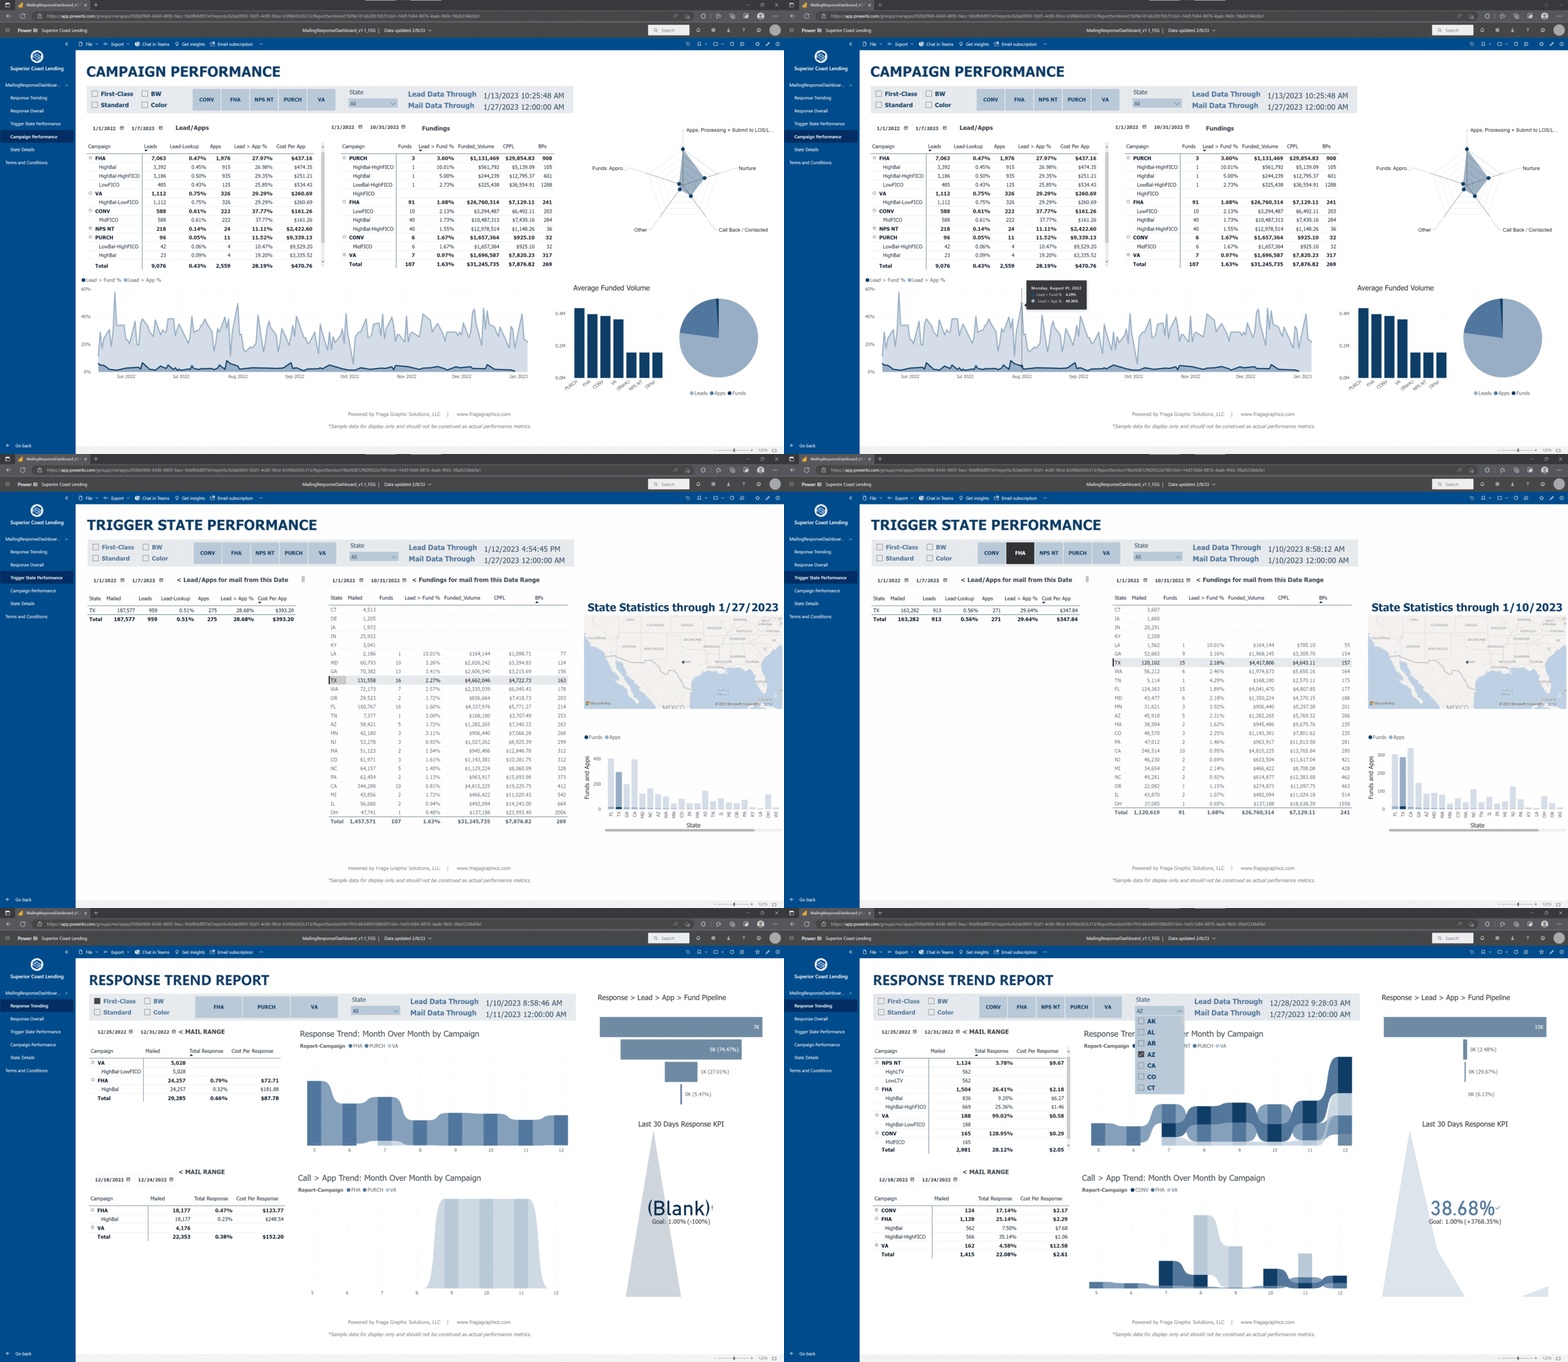
Analyzing data is a crucial step to successful business decisions. With our custom dashboard creation services and reporting tools, you can access and analyze your data in real-time to easily identify trends, measure KPIs, and make strategic decisions. We tailor reports to your specific needs, providing you with the information that is most relevant to your operations to help you drive your business forward.
Start making data-driven decisions
Get started today!
Fill out the form below to connect with our experts and learn more about how our dashboards can help you.
Our reporting tools empower you to make better decisions with the data you have and help you to see real-time trends and patterns in your business performance. You will be able to track key metrics, analyze your data, and create custom reports that can be easily shared with your team.
Your data is as unique as your business and our experts will curate a dashboard reporting solution that works for you. These use cases are just a few examples of how you can effectively utilize your data to make informed decisions. Select a card for more details.
Focused on long-term strategies and high-level metrics
Track performance against set strategic goals
Summarize performance over timeframes
Strategic Dashboards
Shorter timeframes and operational processes
Used for monitoring and managing operations
Monitor and analyze a company’s activities in a given business area
Based on real-time data
Operational Dashboards
Vast amounts of data created by analysts
Relies heavily on historical data to identify trends and compare and create predictions
Analytical Dashboards
Used by mid-management to track performance
Provides ability for user to explore and draw conclusions
Help to support decision making
Has filtering, segmentation, drill-through functionalities
Tactical Dashboards
We’ve helped companies of all shapes and sizes across industries organize crucial data into quick, easy-to-read reports focusing on varying key performance indicators. Click or hover over the icons for industry KPI examples.
Cost per Impression
Response Rate
Actual vs Forecast Trends
Gross Profit Margin
Sales Statistics
Employee Turnover Rate
Waste Management
Labor Utilization
IT Ticket Resolution Time
Server Downtime
Property Details
New Inbound Leads
-
• Exploratory Data Analysis
• Getting and Cleaning Data
• R Programming
• The Data Scientist's Toolbox
-
• People Analytics
• Customer Analytics
• Removing Barriers to Change
• Operations Analytics
• Accounting Analytics
-
• Data Science Fundamentals Specialization
• Cluster Analysis, Association Mining & Model Evaluation
• Predictive Modeling, Model Fitting, and Regression Analysis
• Intro to Analytic Thinking, Data Science and Data Mining
• Natural Language Processing and Capstone Assignment
-
• Microsoft Power BI
• Microsoft Excel
• InDesign
• Illustrator
• R (Programming Language)
-
• Google Data Analytics Professional Certificate
• Ask Questions to Make Data-Driven Decisions
• Data, Data Everywhere
-
• PL-900T00 Microsoft Power Platform Fundamentals by ProTech / The Computer Workshop
• Meta Marketing Analytics Foundation
• Power BI Essential Training
• Telling Stories with Data
• FinTech Law and Policy by Duke University
• Data Science for Business Innovation by EIT Digital
• Data Science Ethics by University of Michigan
Fill out this form to connect with one of our experts today to learn more or get started on your own custom reporting tools today!


